
By Ebenezer Mensah ‘23
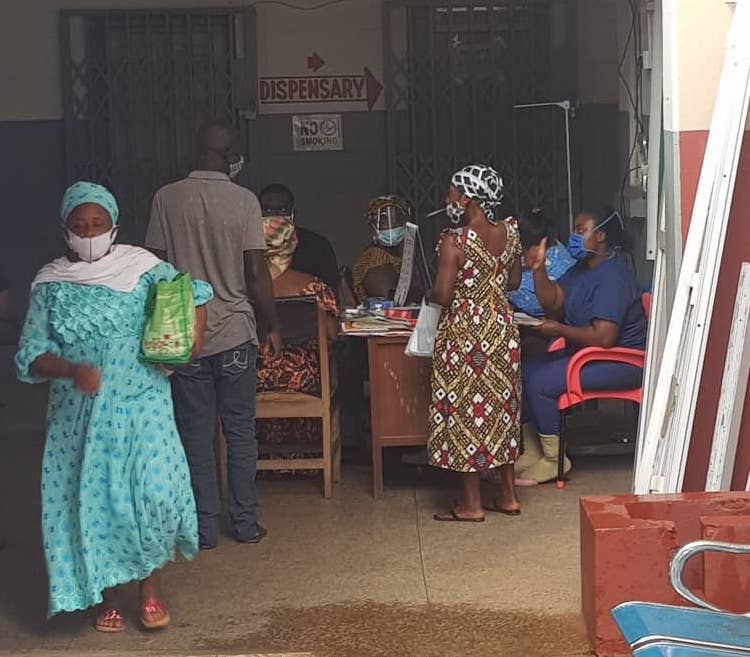
When I was six years old, I remember walking with my father to the doctor’s office, which was in a clinic two towns from where we lived. When we reached the Afari clinic, the only nurse on duty recorded my vital symptoms, including my temperature, pulse, and blood pressure, and told us to wait for our turn. I was the 30th person in line to meet the only doctor available at the clinic. We waited for hours before it was finally my turn. The doctor went over my vital symptoms which were: Pressure: Normal; Temperature: High; Pulse: Normal. He asked me a few questions and diagnosed me with Malaria and prescribed me anti-malaria drugs. Using the same data, a machine learning algorithm predicts that the patient has an 83% likelihood of having malaria.
Inspiration
In my first computer science course here at Pomona, the instructor, Professor Osborn, introduced me to machine learning and, using the Naive Bayes theorem, we wrote a program with Python to classify reviews as either positive or negative. After that class, I kept thinking about my childhood experience and how the efficiency and speed of health diagnoses could be improved using machine learning algorithms. With funds from a Remote Alternative Independent Summer Experience (RAISE) grant from Pomona, I developed a program that offers a prediction of patient diagnoses using the Naive Bayes theorem.
How the algorithm works
The algorithm is based on the Naive Bayes theorem of classification which basically finds the probability of an event occurring given the probability of another event that has already occurred. Bayes’ theorem is stated mathematically as the following equation:
P(A|B) is the posterior probability (probability of B given event A)
P(A) is the prior probability.
Using anonymous patient data that included vital signs of diagnosed patients from three clinics, the algorithm calculates the probabilities of occurrence of vital signs given some level of severity. The posterior probability of each attribute can be calculated by constructing a frequency table for each attribute against the target. Then, transforming the frequency tables to likelihood tables, we can finally use the Naive Bayesian equation to calculate the posterior probability for each class. In our case, an attribute was either a High or Normal level of severity and a target was one of several vital signs, including Temperature, Blood Pressure, and Pulse. For a patient A who was diagnosed with malaria and had a high temperature, normal pulse, and high blood pressure, we calculate the posterior probability of each target given the specific attribute which is either High or Normal and after that multiply all the posterior probabilities.
We calculate the posterior probability for the other diseases using the same attributes, and after that we choose the one with the highest posterior probability as our prediction.
Naive Bayes assumes independence among features. In our case, this means that a patient having a high temperature has nothing to do with a patient’s blood pressure, pulse and so on. This is not always the case, but for practicality our model assumes this is the case. It also assumes that each feature has equal bearing on our target class. So, in our case, a patient’s higher temperature does not make them sicker than would be indicated by their normal pressure or normal pulse.
How the Application Works
The first interface that greets the user shows the usage directions and begins by asking the patient’s temperature. After that, it continues to ask for other vital patient data.

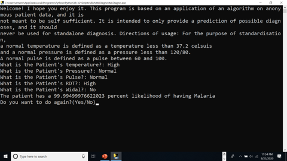
In this case, we can see that our patient has a temperature higher than the normal temperature ranges above and has a normal pressure and pulse. We can also see that the patient’s RDT value is High, and the patient has no Widal test value. The algorithm calculates the likelihood of the patient having either malaria, typhoid, or hypertension, and it provides us with a 99.99% likelihood the patient has malaria. As it turns out, this data is from a patient who was diagnosed with malaria. Finally, the application asks the user if he or she wants to do another calculation for another patient.
Outcome
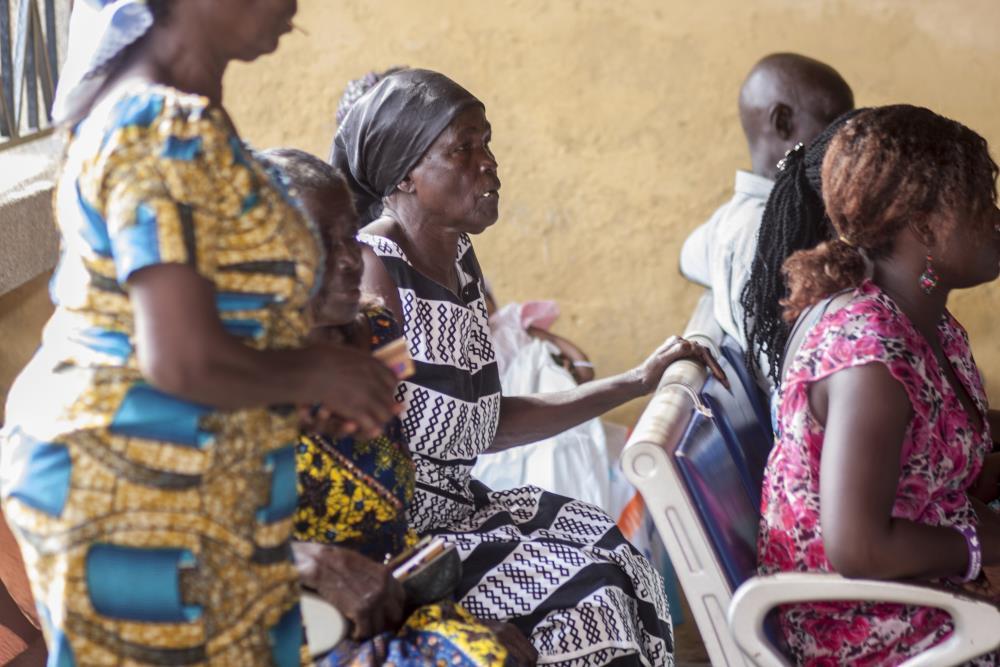
Applying this algorithm to real-world patient data from already diagnosed clinics showed an accurate prediction in 95% of cases with patients diagnosed with either malaria, typhoid, or hypertension. That means the prediction of this algorithm matched the eventual diagnosis of a doctor in all those instances. In cases where patients were diagnosed with more than one disease, the algorithm failed to correctly predict the diseases of the patients most of the time. The application is currently being used in Afari community clinic, a small clinic in my hometown, to help give the doctor an initial possible diagnosis for patients, and they will provide feedback on the algorithm’s predictions.
What is next?
While the program has shown incredible accuracy in predicting the illness of patients with malaria, typhoid, and hypertension, it is still limited in its scope. The three diseases represent a fraction of all outpatient department diseases recorded each day. I hope to expand the program to cover a lot more diseases and include non-quantifiable symptoms and patient remarks that influence how doctors diagnose patients. I also hope to expand the algorithm to be able to give a medication prescription given the patients’ symptoms and diagnoses. It is my hope that through applications like these, we can expand healthcare access and improve the speed and efficiency of diagnosis across the African continent.